Written by: Zhuohan Fang
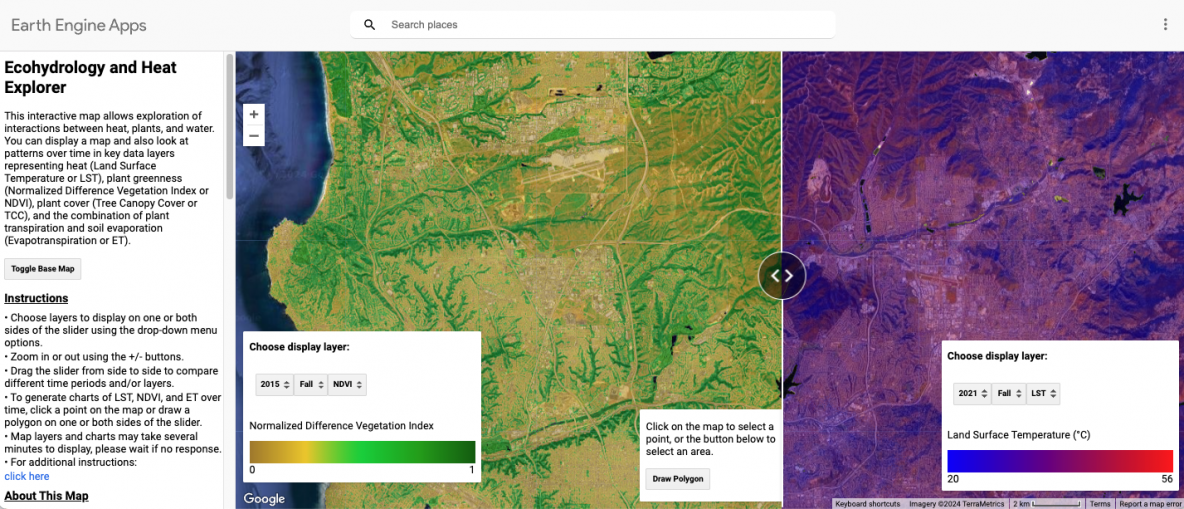
In October 2024, I had the opportunity to present my work developing the Ecohydrology and Heat Explorer (EHE) app at a Teacher/Researcher Collaborative event at the Birch Aquarium. I had the pleasure of working with Morgan Levy within UCSD’s SoCal Heat Hub to develop the app. The EHE is a public online map tool that enables exploration of interactions between heat, vegetation, and water using geophysical data. The data that are accessible in the EHE are the same data that UCSD researchers use to investigate the localized impacts of extreme heat on vegetation and water dynamics in coastal zones like San Diego.
Research Focus and Presentation Highlights
The EHE app enables users to visualize spatial environmental data, including Land Surface Temperature (LST), Normalized Difference Vegetation Index (NDVI), and Evapotranspiration (ET) across the Western U.S. Users can explore relationships between these different datasets by comparing different time periods, locations, and environmental conditions—such as during the 2016 drought versus the non-drought year 2020.
For example, during our first presentation of the app to teachers, we demonstrated differences in vegetation greenness (NDVI) and landscape water consumption (ET) at the local Kearny High School and a nearby canyon. During the summer of the drought year (2016), canyons and fields around the school showed lower NDVI and ET values, indicating water-stressed vegetation. In contrast, the same region showed higher NDVI and ET values in 2020, indicating greener, less water-stressed vegetation. The built-up school campus had land surface temperatures that were generally warmer than the neighboring green space, regardless of drought conditions. This is an example of how a tool like the EHE can help users understand the role of green spaces in heat adaptation and sustainable water management.

Title screen of the presentation that Zhuohan and Morgan gave at the October Teacher Researcher Collaborative.
Engaging with the Community and Gathering Feedback
Presenting at this event was an exciting opportunity to connect with other researchers and stakeholders, including government agencies and community partners. The interactive nature of the app allows attendees to explore data in real-time, and fosters engaging discussions about how vegetation can mitigate extreme heat through evapotranspiration and shading. We also received valuable feedback on the user experience, which will inform future improvements to the app. This aligns with the project’s goals of research “co-production” and community engagement.
Learning from Others and Looking Ahead
Participating in this event expanded my understanding of how different fields approach climate challenges, as well as corresponding solutions for ecohydrology and sustainable greening. The journey with the EHE project continues, and I look forward to further exploring related datasets and discovering new ways to expand the EHE’s capabilities. As we refine our understanding of the connections between heat, plants, and water, our team is optimistic about contributing to more resilient climate adaptation strategies in Southern California and beyond.
Header image: A screenshot of the Ecohydrology and Heat Explorer app.

